By: Mac Becco, LPLA Communications Director
Lake Pepin might be the world’s best kept secret, a natural treasure tucked away among expansive agricultural fields. Unlike its surroundings, the rich oasis is relatively protected from human development due to its steep bluffs and protected waterways. Upon entering one of the quaint community downtowns, you may feel like you’ve gone back to a simpler, kinder time. Yes, Lake Pepin is a special place to live and visit. Unfortunately, the lake and surrounding communities may turn out to be more of a mirage than an oasis if excess sediment and nutrient input continue.

Photo by Jay Olson-Goude
For those familiar with Lake Pepin, the water quality concerns are old news, maybe even an annoying broken record. Despite dramatic phosphorus decreases from point sources since 2000 (Figure 1), Lake Pepin is still filling up with sediment and impaired for excess nutrients.
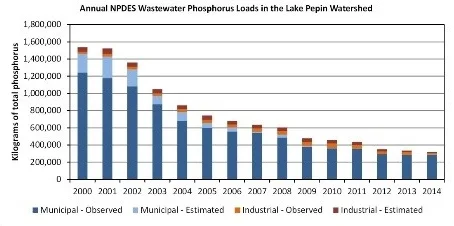
Figure 1. Annual NPDES Wastewater Phosphorus Loads in the Lake Pepin Watershed; Source: Minnesota Pollution Control Agency
Based on the USGS Upper Mississippi River Restoration Program’s Long Term Resource Monitoring (LTRM), the total suspended solids (TSS) and total phosphorus (TP) in Lake Pepin during the summer has been relatively constant since 1993 (Figure 2, Figure 3).
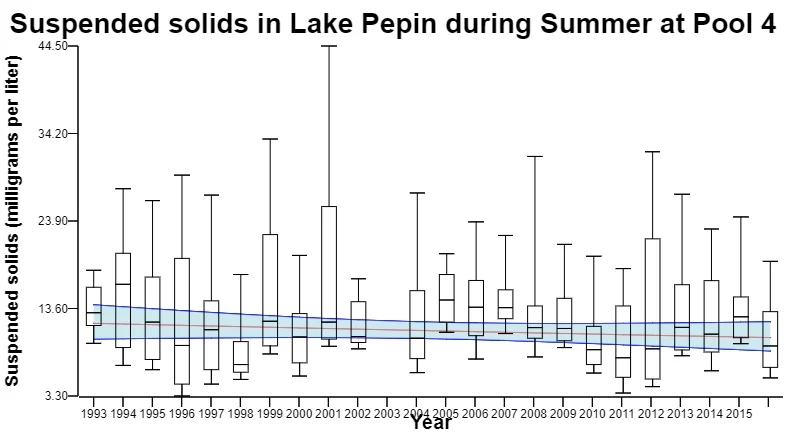
Figure 2. Suspended Solids in Lake Pepin
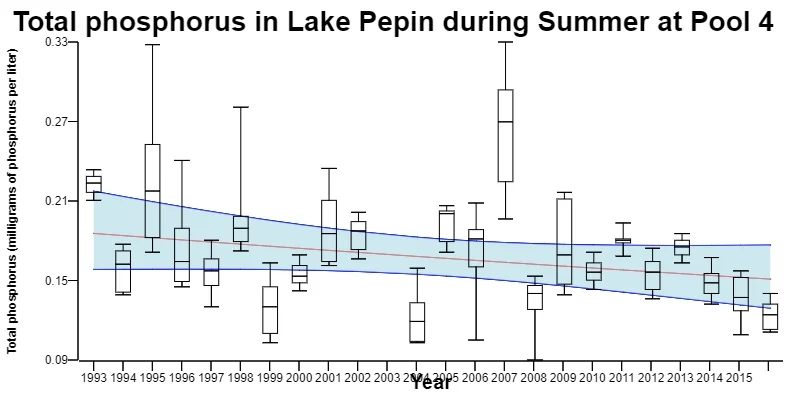
Figure 3. Total Phosphorus in Lake Pepin.
Those numbers, however, might be a better indicator of the size of the problem than how much progress is being made. Moreover, they do little to describe ecological health of the system. To get a comprehensive view of the status of Lake Pepin, you need to get into the weeds and understand some of the complex dynamics at play.
A Tale of Two Systems
Sediment and phosphorus, the two culprits of Lake Pepin water quality woes, don’t present impacts equally across the lake. Upper Lake Pepin continues to watch peninsulas extend, islands form, and shallow depth impede recreation. Meanwhile, Lower Lake Pepin endures periodic algae blooms that can cover widespread areas.
Given that most water is coming from the same input, why do we have this distinction?
“As for Lake Pepin, it’s really a tale of two systems,” says Shawn Giblin, a Water Resource Management Specialist with the Wisconsin DNR, “It’s very turbid in the upper end, but the water can be really quite clear at the outlet.”
Upper Lake Pepin is plagued with sediment input from incoming flows, mainly the Minnesota River. Once water enters the wider lake basin, the velocity slows and sediment falls from the water column. As such, the turbidity and total suspended sediment (TSS) levels are significantly higher near the head of Lake Pepin (30-40 mg/L) than the outlet (5-10 mg/L). The difference is easily visible with aerial photography.

Okay, but why doesn’t Upper Lake Pepin experience algae blooms in the same way the lower half does?
Upper and Lower Lake Pepin both have excess phosphorus, but only Lower Lake Pepin is susceptible to large algae blooms. The turbidity in Upper Lake Pepin blocks light penetration and thereby the biological processes that lead phosphorus to cause algae blooms. The MN DNR documented the last major algae blooms in 2014. The lack of algae blooms in recent years may give a false sense of relief.
Rob Burdis, a Water Quality Specialist with the Minnesota DNR explains, “We’ve seen improvement here and there, but we haven’t seen real improvements in nutrients and sediment load during the summer within the open water.”
If we haven’t achieved significant sediment and nutrient reductions, why hasn’t Lower Lake Pepin had algae blooms in since 2014? Well, there is another major factor that impacts water quality in Lake Pepin: flow and water residence time.
The X Factor: Flow and Water Residence Time
Lake Pepin is a dynamic system with multiple factors affecting water quality and subsequent impacts. Shawn Giblin, recalls a biologist mentor always saying, “There is no such thing as a normal year in Lake Pepin.”
As a lake within a riverine system, Lake Pepin is highly influenced by water flow and residence time. Giblin explains, “During low flows, water takes 40-50 days to move completely through Lake Pepin to the outlet. During the high flows, the water residence time can be as short at 7-8 days.” These flow variations can lead to dramatically different water quality conditions.
According to the MN DNR, Lake Pepin has been experiencing high flows since 2010, which make it difficult for algae to get established. Justin Watkins, with the Minnesota Pollution Control Agency (MPCA) says that, “Based on the work of Heiskary and Wasley in 2010, when flows are above 20,000 cfs at the Prescott, WI water gauge, Lake Pepin is much less likely to experience algae blooms.” Recent chlorophyll levels are below the standard, which validates that algae density is low and water is clear. This is good news, but should not be misunderstood as significant water quality improvements.
While high flows buffer against algae blooms, they also contribute to greater non-point sediment loading. Residents and visitors probably noticed highly turbid waters in Upper Lake Pepin this spring.

“You have variability from year to year, but a lot of that is due to weather patterns that affect discharge in the river,” explains Rob Burdis. “Only in drought conditions do we have lower sediment loading in Pool 4. Years with high flows and large rainfall events, you can expect sediment loads to be greater.”
Since phosphorus binds to sediment particles, high summer flows also contribute more phosphorus from upland fields, bluffs, streambanks, and ravines. The insurgence from non-point sources masks the recent phosphorus reductions from point source.
Burdis explains, “The Metropolitan Council has done a phenomenal job removing phosphorus from their treatment plants. They’ve had about an 80% reduction since the early 2000’s. We can observe that decrease in the winter time, but we don’t pick it up as well in the summer because you have all these non-point sources contributing.”
Flow cycles are normal and local experts don’t think that high flows will continue forever. For example, Lake Pepin had high flows from 2001-2005, but then low flows from 2006-2010. Despite climate change and higher agricultural discharge, low flow years and algae blooms will eventually return to Lake Pepin. So, while there is reason to celebrate large phosphorus reductions from point sources, we shouldn’t become overly optimistic or complacent. In Lake Pepin, non-point sources dominate and high flows can exacerbate their impact while masking ongoing water quality issues in Lower Lake Pepin. It is important to take actions now that protect against the vulnerability that is certain to cycle back.
The Lake Needs Healthy Organs
Lake Pepin is a living system that depends on diversity to support diversity. Burdis says, “Large rivers that are healthy have diverse habitats that allows for high species diversity.” It’s not that different than the human body with specialized organ systems communicating via chemical feedback loops. As such, it can be useful to consider the entire system of Pool 4, extending from Lock and Dam 3 in Hager City to Lock and Dam 4 near Alma, WI. The Long-Term Resource Monitoring database is part of the Upper Mississippi River Restoration Program through the United States Geological Survey (USGS) at led by the MN DNR in Lake City, MN. It describes four different habitats or strata within Pool 4, including the pool, main channel, side channels, and backwaters.
Among these habitats, Shawn Giblin says, “Backwaters are the lifeblood of the Mississippi. They provide spawning and overwintering habitat for fish, refuge during floods, and are the primary areas used by waterfowl.” In other areas of the Mississippi River, backwaters filled in and, in response, ecological systems diminished. Lake Pepin still has productive backwaters, but Gilberts says, “We are losing some of them every year, just like Pepin. Around ½ to 1 ½ cm. of sediment accumulates annually, which leads to a loss of backwaters over time.”

Catherine Pass, near Bay City. Photo by David Meixner
The WI DNR is collecting preliminary data from the backwaters to guide the proposed restoration project. Current data shows that TSS exceeds water quality goals, water depths are decreasing, and there is lack of healthy vegetation. The good news is that TSS within the backwaters is near an ecological tipping point, meaning that local restoration could provide a strong return on investment.
Ecosystem Tipping Points
Impaired water quality suggests there will be detrimental impacts to ecological and social systems. Yet, despite water quality concerns, Lake Pepin has a thriving fishery, healthy invertebrate populations, and abundant wildlife. Zebra mussels fluctuate throughout the years, but haven’t been as abundant as when they first appeared. This year especially, fisherman will be happy to know that the perch fishing is way up.
Rob Burdis confirms that, “Water quality issues don’t seem to be having a severe impact on the ecosystem right now.”
How can water quality be impaired and still support a thriving system? The answer may lie with new understandings of water quality thresholds and ecological tipping points.
Shawn Giblin recently published a paper in Freshwater Ecology that examines the ecological shifts below Lake Pepin in Pool 8. In the 1980’s, the local fishery collapsed, healthy vegetation disappeared, and water turbidity increased.
Giblin, a native from the area, recalls his personal experience, “I grew up near La Crosse and it was tough time on the river. There was this nice recreational fish community, but when the vegetation crashed the recreational fish community collapsed right along with it. There was a period when things were really tough. We couldn’t get out of that turbid state.”
Researchers now understand that TSS has a central role in ecological shifts. As a result, TSS thresholds can be calculated to predict negative shifts and manage systems towards positive ones. A negative ecological shift can start with water turbidity, which limits the light penetration needed by healthy macrophytes (aquatic plants) to take root and grow. Without aquatic macrophytes, the entire ecological system can start collapsing: phytoplankton biomass increases, invertebrate biomass decreases, zooplankton refuge is reduced, and fish communities shift to support more invasive and benthic species.
Giblin’s study highlights how cascading impacts can create positive feedback loops that exacerbate the negative cycle. Without rooted vegetation, there is less sediment stabilization and more sediment resuspension from wind and waves. As turbidity increases, common carp become relatively more abundant too. The bioturbidation from these benthic dwellers further increases sediment resuspension thereby reinforcing the cascade of impacts from turbid waters. A focus on these ecological connections is critical to achieving a goal of 50% reduction in resuspended sediment in Lake Pepin, as outlined in the Upper Mississippi TMDL study.
Fortunately, Pool 8 did rebound in the early 2000’s due to reduction in TSS levels, which led to numerous biological process that reshaped the ecosystem to a healthier state. Giblin says, “Once you get the aquatic vegetation established, you get a number of feedbacks that reinforce the system. It makes the water progressively clearer and shifts the fish composition”. In his research study, Giblin calculated that once TSS reached 16 mg/L, there was a 3x increase in recreational fish biomass and 3x increase in native fish biomass.
Reducing TSS to meet water quality thresholds is important to ensure the ecosystem is not susceptible to sudden collapse. Giblin’s research is optimistic, but also conveys an important warning, “Systems can experience positive or negative ecological shifts. When the system shifts in a negative direction, you lose aquatic vegetation and it is difficult to flip it back to the more desirable state.”
The backwaters in Upper Lake Pepin have TSS levels closer to the ecological threshold than the open water system. For that reason, among others, “They are an opportunity to do a local project that has impact. It’s something we have control over the capability to improve,” says Robert Burdis.
Lake Pepin Legacy Alliance agrees, but remains committed to reducing open water sedimentation by dredging shallow areas and constructing islands to protect areas, including backwaters, from refilling with sediment.
Signs of an Unhealthy Lake
Ongoing monitoring is critical to improving water quality, but you don’t need a chemistry background or laboratory equipment to participate. The easiest and most common signs of an unhealthy lake are turbid water, algae blooms, and a lack of macrophytes. After heavy rainfall events, you might see large plumes of suspended sediment at the mouths of local tributaries. Of course, be careful not to mistake healthy vegetation as a nuisance since macrophytes provide critical habitat, stabilize sediment resuspension, and balance other ecosystem processes.
People intimately familiar with Lake Pepin for decades are also able to see peninsulas extend and islands form. For everybody else, you can always take a paddle around Wacouta Bay or Bay City. We challenge you not to hit the bottom.