Nitrates create water quality concerns for human and ecosystem health. High nitrate levels in drinking water are linked to diseases such as methemoglobinemia, or blue baby syndrome, which reduces the oxygen-carrying capacity of hemoglobin in the bloodstream. High nitrate in surface water contributes to eutrophication and the creation of large hypoxic zones. The lack of oxygen in these areas impacts the survival of both freshwater and marine species and leads to harmful algae blooms.
Over the last two years, I’ve been assisting research projects that are evaluating saturated buffers as a tool for nitrogen abatement. By creating wells in the saturated buffer, I've been able to take water samples from the Legvold saturated buffer and another site near Dodge Center, MN and compare them with the level of nitrogen, nitrate, and nitrite of samples taken from control sites. Preliminary results last summer suggested that saturated buffers lead to lower nutrient levels, but data was inconclusive due to outliers from extreme weather events.
With additional data from this summer, we have more confident results showing that saturated buffers are an effective tool for nitrogen abatement from agricultural runoff. As seen in Figures 1-2, water samples taken from saturated buffers at both locations have lower nitrate levels than the control structure (CS) and nearby creek. Additional data will be coming in throughout the rest of the summer, and hopefully will corroborate these findings.
Saturated buffers are not a substitute for other agricultural practices that address the source of pollution, but they do appear to serve as a viable option to reduce the impact of agricultural runoff. When agricultural runoff is diverted to the saturated buffer, plants and soil organisms absorb potentially harmful nutrients as water moves through the soil.
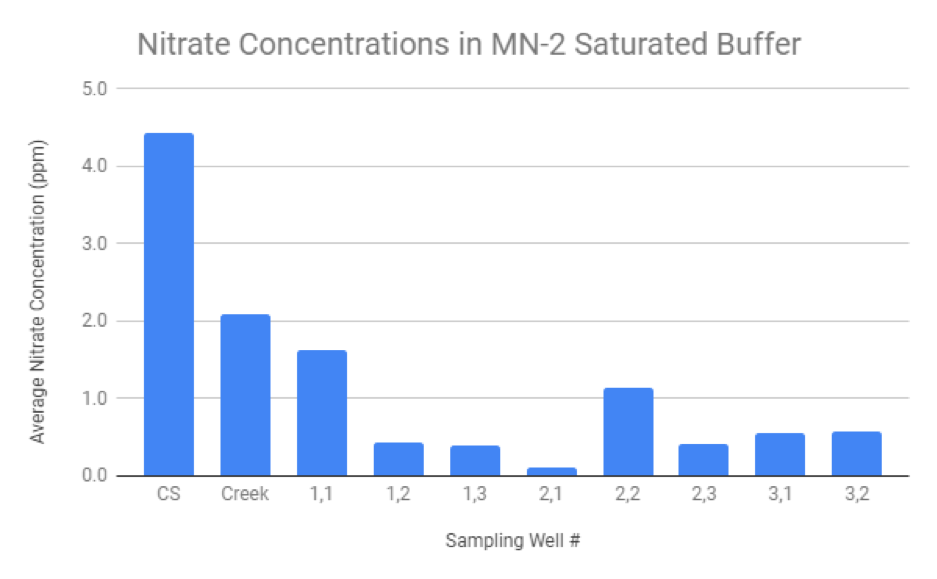
Figure 1. This chart shows nitrate levels in the control structure, creek, and sampling wells on the Legvold saturated buffer in Northfield, MN. Measurements are averaged between November, 2017 and May, 2018. Lower levels of nitrate in the sampling wells indicate nitrate reductions as agricultural runoff moves through the saturated buffer. For reference, the drinking water standard in Minnesota is 10 ppm nitrate.

Figure 2. The above chart corresponds to a saturated buffer near Dodge Center, MN. Although the patterns are not exactly the same as those in the Legvold buffer, all of the sampling wells show significant nitrogen abatement compared to the control structure and the creek.
---

Claire Hinther is a rising junior at St. Olaf College in Northfield, MN. She is pursuing a double major in political science and environmental studies with a concentration in women’s and gender studies. A native of Missoula, Montana, she grew up hiking in Glacier National Park, biking in Western Montana and Idaho, and spending long days fishing and swimming the three rivers in her hometown. Through these childhood experiences, she has developed a deep love for the outdoors and a great appreciation for the value of our environment.